Uncovering a Memory Leak using WinDbg

The Crash…

Recently, we’ve been having a Windows service hosting a WCF endpoint crashing increasingly frequently due to out of memory errors. Although the usage of the service had increased, it didn’t seem likely that the service would actually consume its entire address space in the course of legitimate operation, so I naturally assumed a memory leak.

First, I perused all static collections and looked for any possible leaks. Only one small leak was found through inspection, which I strongly doubted could be the actual cause. Another staff recommended that the SQL server might be consuming all available memory, and that an upper limit should be set. We did indeed set the limit. However, these two changes did not resolve the issue. One of my coworkers suggested investigating the crash memory dump using WinDbg.

Using WinDbg

I hadn’t used WinDbg before and getting started was, frankly, daunting. After several hours, however, I was able to get an effective flow. The first mistake I made was loading the wrong bitness of WinDbg. The application in question is 32-bit (due to its dependency on several legacy DLLs), but I was trying to use the 64-bit WinDbg. No dice (but some strange and confusing errors that slowed me down). Finally I got the right WinDbg and the right memory dump and I was ready to go.

After opening the dump, the first step is to load the reference symbols for Microsoft DLLs:

.sympath srv*http://msdl.microsoft.com/download/symbols
.reload

Next, in order to enable debugging of .NET memory dumps, a specific .NET plugin, psscor, needs to be loaded. Since this is a .NET 4 app, version 4 of psscor is needed.
I heavily leaned on the article Intro to WinDbg for .NET Developers. Note in the subsequent examples references to “k:\windbg” represent the working directory where I accumulated the dump and helper files.

.load k:\windbg\psscor4.dll
.symfix c:mylocalsymcache 
.cordll -ve -u -l

These commands will be sufficient for basic .NET debugging. But as I thrashed around for several hours exploring the dump, I found another plugin that extends psscor with additional capability. The SOSEX extension specifically includes reference tracking, which I found very helpful.

.load k:\windbg\sosex.dll
!bhi

A helpful cheat sheet clearly describes all available commands at this point.

Another short article on debugging memory leaks got me on the right track. I also referenced a source describing how to access object values.

An overall view of memory usage, sorted from least total usage to most, is the first point of analysis:

!dumpheap -stat
Statistics:
      MT    Count    TotalSize Class Name
...[many small entries omitted]
71148b08    10520      1346560 System.Data.DataColumn
735ceb9c    17895      1431600 System.Runtime.Remoting.ServerIdentity
735f0764    13218      1506528 System.Int32[]
735f2388    10785      4252704 System.Collections.Hashtable+bucket[]
735d6a0c     3313      7084876 System.Decimal[]
711493a0       52     17129584 System.Data.DataRow[]
735ef46c    32056     21923408 System.String[]
735eed0c    12115     36322560 System.Object[]
735f35fc    59441     54614724 System.Byte[]
735ee918  3079311     64983264 System.String
71149898      932     90479536 System.Data.RBTree`1+Node[[System.Data.DataRow, System.Data]][]
735eba00  5610857    134660568 System.Guid
71148a30  2821656    191872608 System.Data.DataRow

I immediately noticed that the top entry was DataRow, and several other of the top entries seemed to be related (RBTree of DataRow, DataRow[], and DataColumn). Guid is also related, since all the rows in the database (and, thus, all DataRow in memory) are keyed on Guids. The application in fact uses DataTable heavily to bridge SQL and WCF. In no case, however, should the application be holding several million rows in active memory. According to this dump, more than 2 million DataRows are accumulated in process memory.

I suspected a leak where DataRows were being retained. However, no instance of DataTable, DataColumn, nor DataRow are being retained in any obvious or explicit cache or static table.

Next step is to investigate the details. Since DataRow is the largest, I selected it to investigate further. Note the “71148a30” refers to the MT (method table) from the previous output.

!dumpheap -mt 71148a30

This run outputs thousands of entries, but visually as they flow by, you can see that they are “clustered”, suggesting a relatively small number of collections with many many rows each. Supporting this visual analysis is the “52” instances of DataRow[] in the first listing.

Address       MT     Size
015540a8 71148a30       68     
0155412c 71148a30       68     
015541b0 71148a30       68     
01554234 71148a30       68     
015542b8 71148a30       68     
...[thousands of rows omitted]
3ad0c110 71148a30       68     
3ad0c17c 71148a30       68     
3ad0fd78 71148a30       68 

So we’ve confirmed that we have a variety (probably 52) DataTables in memory each with many, many rows. This latter part is unusual, since there are few places in the application which expect many, many rows. Most DataTables have 1 to 100 rows, not thousands+.

It might be useful, instead, to follow the chain of the 52 DataRow[] entries. Note the MT reference for them from the first table: 711493a0

!dumpheap -mt 711493a0
 Address       MT     Size
015ee00c 711493a0       12     
015f16e4 711493a0      524     
01a6506c 711493a0       12     
01c60bb4 711493a0      524     
...[couple dozen rows omitted, all size = 524]   
2c276c28 711493a0      524     
2c6a5278 711493a0      524     
3996c578 711493a0    65548     
40a98ed8 711493a0   262156     
53071010 711493a0 16777228     

Whoa what’s this. A single DataRow[] (that is, a single table) is taking a HUGE amount of memory. Naturally that’s a target of interest. However, the many smaller entries could be interesting as well. We can investigate both.

The first leak – many smaller objects

First, we’ll investigate the smaller, many instance.

We can use the gcroot command to find the path (or paths) from the object to the active, live object at the root of the application.

!gcroot 2c276c28 
HandleTable:
    00c613ec (pinned handle)
    -> 024c34c8 System.Object[]
    -> 01bff620 System.Collections.Generic.Dictionary`2[[System.Object, mscorlib],[System.Collections.Generic.List`1[[Microsoft.Win32.SystemEvents+SystemEventInvokeInfo, System]], mscorlib]]
    -> 01bff968 System.Collections.Generic.Dictionary`2+Entry[[System.Object, mscorlib],[System.Collections.Generic.List`1[[Microsoft.Win32.SystemEvents+SystemEventInvokeInfo, System]], mscorlib]][]
    -> 01c0d9f0 System.Collections.Generic.List`1[[Microsoft.Win32.SystemEvents+SystemEventInvokeInfo, System]]
    -> 0dee8adc Microsoft.Win32.SystemEvents+SystemEventInvokeInfo[]
    -> 2c2214ac Microsoft.Win32.SystemEvents+SystemEventInvokeInfo
    -> 2c22148c Microsoft.Win32.UserPreferenceChangedEventHandler
    -> 2c27b3ac System.Windows.Forms.ContextMenuStrip
    -> 2c27b650 System.ComponentModel.EventHandlerList
    -> 2c27c650 System.ComponentModel.EventHandlerList+ListEntry
    -> 2c27c388 System.ComponentModel.EventHandlerList+ListEntry
    -> 2c27c354 System.ComponentModel.EventHandlerList+ListEntry
    -> 2c27c320 System.ComponentModel.EventHandlerList+ListEntry
    -> 2c27c300 System.EventHandler
    -> 2c27b178 Microsoft.Reporting.WinForms.ReportPanel
    -> 2c27acc8 Microsoft.Reporting.WinForms.WinRSviewer
    -> 2c279e64 System.Windows.Forms.Panel
    -> 2c279af0 System.Windows.Forms.TableLayoutPanel
    -> 2c2798a0 Microsoft.Reporting.WinForms.RVSplitContainer
    -> 2c277a3c System.Windows.Forms.Panel
    -> 2c2776d4 System.Windows.Forms.TableLayoutPanel
    -> 2c277484 Microsoft.Reporting.WinForms.RVSplitContainer
    -> 2c276e84 Microsoft.Reporting.WinForms.ReportViewer
    -> 2c277114 Microsoft.Reporting.WinForms.ReportHierarchy
    -> 2c277124 System.Collections.Generic.Stack`1[[Microsoft.Reporting.WinForms.ReportInfo, Microsoft.ReportViewer.WinForms]]
    -> 2c21f0ac Microsoft.Reporting.WinForms.ReportInfo[]
    -> 2c21efec Microsoft.Reporting.WinForms.ReportInfo
    -> 2c220fc4 Microsoft.Reporting.WinForms.LocalReport
    -> 2c28de40 Microsoft.Reporting.WinForms.SubreportProcessingEventHandler
    -> 2c218b40 <error>
    -> 2c22ce00 System.Data.DataSet
    -> 2c22ce6c System.Data.DataTableCollection
    -> 2c22ce90 System.Collections.ArrayList
    -> 2c2398f8 System.Object[]
    -> 2c22f884 System.Data.DataTable
    -> 2c22fa0c System.Data.RecordManager
    -> 2c276c28 System.Data.DataRow[]

That’s a lot to take in. The list goes from the bottom (the instance in question) to the top. On the way, it tells us this table is owned by a WinForm SSRS reporting component which in turn is held alive by an event handler.

You might recall this application is not a Desktop app; it is a headless Windows service. Nevertheless, we embed the Winforms SSRS component to be able to convert RDL into PDF as part of an automated process. This happens occasionally, and once the PDF is done no further work is done on the data. There is absolutely NO REASON multiple alive references should exist to this component. It’s a leak!

But why?

Looking into the code exposes the reason:

var sia = new WsbisReports.BridgeInventory.SI.SIA();
sia.PrepareReport(result, p);
// ... find destFilePath
sia.CreatePDF(destFilePath);  

Here SIA inherits from a class which encapsulates WinForms LocalReport. What’s missing? Dispose. LocalReport is a disposable class, but my consumers never call Dispose on it. Corrective action? Make the SIA (more correctly, the base RDLReport class in the application) implement IDisposable, have it Dispose the LocalReport object, and wrap all instances in a using statement to ensure disposal.

A discussion online indicates that, in additional to disposal, several other actions might be helpful:

  • report.ReleaseSandboxAppDomain();
  • Unsubscribe to any SubreportProcessing events
  • Clear Data Sources
  • Dispose the report

The first three actions can be completed in the new Dispose method once the encapsulating class implements IDisposable.

A few large objects

There are three larger DataTable objects in this dump. We’ll look at each one. We’ll start with the smallest of the three.

!gcroot 3996c578 
Thread 9e78:
    0b97ef3c 7072cf80 System.ServiceModel.Channels.ServerReliableChannelBinder`1+DuplexServerReliableChannelBinder`1[[System.__Canon, mscorlib],[System.__Canon, mscorlib]].OnSend(System.__Canon, System.ServiceModel.Channels.Message, System.TimeSpan)
        ebp-10: 0b97ef4c
            ->  39c11654 System.ServiceModel.Security.SecurityAppliedMessage
            ->  39c11158 System.ServiceModel.Dispatcher.OperationFormatter+OperationFormatterMessage
            ->  39c11178 System.ServiceModel.Dispatcher.OperationFormatter+OperationFormatterMessage+OperationFormatterBodyWriter
            ->  390f6220 System.Data.DataSet
            ->  390f628c System.Data.DataTableCollection
            ->  390f62b0 System.Collections.ArrayList
            ->  3922fa2c System.Object[]
            ->  3922e600 System.Data.DataTable
            ->  3922e788 System.Data.RecordManager
            ->  3996c578 System.Data.DataRow[]

Conclusion: This is an “in-flow” object being processed by WCF. Not a leak.

How about the medium-sized object?

!do 40a98ed8 
Name:        System.Data.DataRow[]
MethodTable: 711493a0
EEClass:     7322f4e4
Size:        262156(0x4000c) bytes
Array:       Rank 1, Number of elements 65536, Type CLASS

First glance, it appears that the table has allocated an array for up to 65,536 rows. That’s a lot of rows compared to the in-memory tables normally processed. We can trace the objects life through the garbage collector.

!gcroot 40a98ed8 
Thread 2668:
    1531daf0 07887608 WsbisWcfService.dll!Unknown
        ebp+e8: 1531dbdc
            ->  3a09b9d0 System.Data.DataTable
            ->  3a09bb58 System.Data.RecordManager
            ->  40a98ed8 System.Data.DataRow[]

This object is alive, with a reference being held by our service.

We can first use the owning DataTable to find out the actual number of rows (65,536 is just the allocated array size).

!mdt 3a09b9d0 
3a09b9d0 (System.Data.DataTable)
...[omitted rows]
    nextRowID:0xad77 (System.Int64)
...[omitted rows]

0xad77 = 44,407 in decimal. So the table has about 44 thousand rows. Still a lot of rows for what the app normally does, but not inconceivably huge.

What’s the location of the hold? Since I’m new to WinDbg, I wasn’t able to figure out how to get the method name from the address, but I was able to decompile the method:

!u 07887608
Normal JIT generated code
WsbisWcfService.dll!Unknown
Begin 07886ef8, size 9bf
07886ef8 55              push    ebp
07886ef9 8bec            mov     ebp,esp
...[omitted rows]
07886f95 ff35b4dd6002    push    dword ptr ds:[260DDB4h] (" request received from ")
...[omitted rows]
07887603 e8f89149f9      call    00d20800 (WsbisClient.dll!Unknown, mdToken: 0600004d)
>>> 07887608 e8704ec86c      call    clr!IL_Rethrow (7450c47d)
0788760d c745e400000000  mov     dword ptr [ebp-1Ch],0
...[omitted rows]
0788769d 8b15dcdd6002    mov     edx,dword ptr ds:[260DDDCh] ("SYS_CHANGE_OPERATION")
...[omitted rows]

So the key thing I picked up in the giant code dump is the string constants, which let me identify the method in question. Further, I note that the instruction is a “rethrow”, so I tracked down the try-catch with a rethrow between the two string constants in the method. This lets me precisely identify where the execution pointer was in method was when the dump was created.

The method is called “GetChangeTable” and is used by the client to request a table of rows that have changed for local database synchronization purposes. However, 44,000 rows in a single request is unusually high for synchronization, which happens rather continually. Even when the client is disconnected for several days, a single batch of 44,000 is more than expected.

Let’s find out more before moving on.

Finding the data in a DataTable

In normal .NET code, we can access the data in a DataTable via an indexer on the Rows property, e.g. t.Rows[0][“column”]

However, looking at the memory dump for the DataTable, it is more difficult to find the actual data. I ended up referencing the actual .NET source code for DataRow to find out where the data is stored:

/// <devdoc>
///    <para>Gets
///       or sets all of the values for this row through an array.</para>
/// </devdoc>
public object[] ItemArray {
  get {
    int record = GetDefaultRecord();
    _table.recordManager.VerifyRecord(record, this);
    object[] values = new object[_columns.Count];
    for (int i = 0; i < values.Length; i++) {
      DataColumn column = _columns[i];
      VerifyValueFromStorage(column, DataRowVersion.Default, column[record]);
      values[i] = column[record];
    }
    return values;
  }

So the row's item array isn't real at all! The data is actually stored on the column.

!mdt 3a09b9d0 
3a09b9d0 (System.Data.DataTable)
...[omitted rows]
    columnCollection:3a09bb90 (System.Data.DataColumnCollection)
...[omitted rows]

!mdt 3a09bb90
3a09bb90 (System.Data.DataColumnCollection)
...[omitted rows]
_list:3a09bbc8 (System.Collections.ArrayList)
...[omitted rows]

!mdt -e:2 3a09bbc8
3a09bbc8 (System.Collections.ArrayList)
[0] 3a0dc77c (System.Data.DataColumn)
...[omitted rows]
    _columnName:3a0dc6ec (System.String) Length=20, String="SYS_CHANGE_OPERATION"
...[omitted rows]
    _storage:3a0dc908 (System.Data.Common.StringStorage)
...[omitted rows]

!mdt 3a0dc908
3a0dc908 (System.Data.Common.StringStorage)
    Column:3a0dc77c (System.Data.DataColumn)
...[omitted rows]
    values:40a18e98 (System.String[], Elements: 65536)

Let's stop here for a minute. We've found that the first column is named "SYS_CHANGE_OPERATION", which confirms that this table is a GetChangeRows synchronizer table (because that's the hard-coded column name in the SQL procedure that generates the change table result). We've further found the backing array of up to 65,536 values for the column. This column indicates a command code which describes what kind of operation will be done (update, insert, delete, or re-sync).

!mdt -e:2 -count:5 40a18e98
40a18e98 (System.String[], Elements: 65536)
[0] 3a0dc8e0 "R"
[1] 3a0dc9a8 "R"
[2] 3a0dca14 "R"
[3] 3a0dca80 "R"
[4] 3a0dcaec "R"

The elements are command code "R", which is used when the client needs to resync the entire table. That explains why there are so many rows! The server already has a mechanism that allows it to tell the client to request a subset of rows. Maybe to save memory, the server should ALWAYS require the client to request a subset of rows when a resync is performed? That will mean smaller DataTable allocations.

Looking at the source code reveals a rather silly "bug": The server has a maximum row limit. If the row limit is exceeded, it will refuse to send the table to the client and send a message telling the client to request fewer rows. However, the server still loads the ENTIRE table from the SQL procedure, and then counts the rows using Rows.Count. This means, at least temporarily, an unnecessary very large table will exist in memory! The SQL procedure should be modified to take the max rows as a parameter, and simply return a message to the service if there are too many rows (rather than returning the whole table, having the service instantiate it in memory, and then count the rows).

The "final" twist

We've uncovered a lot so far, but there's still that monster giant DataTable to investigate.

!do 53071010 
Name:        System.Data.DataRow[]
MethodTable: 711493a0
EEClass:     7322f4e4
Size:        16777228(0x100000c) bytes
Array:       Rank 1, Number of elements 4194304, Type CLASS

Wow! That's a huge table! Note that the number of rows FAR exceeds the maximum row limit (described previously) that should ever be sent! We can trace the objects life through the garbage collector.

!gcroot 53071010 
Finalizer Queue:
    19d71aac
    -> 19d71aac System.Data.DataColumn
    -> 19d6c49c System.Data.DataTable
    -> 19d6c624 System.Data.RecordManager
    -> 53071010 System.Data.DataRow[]

Warning: These roots are from finalizable objects that are not yet ready for finalization.

Wait, what? I had always assumed objects had two states: alive (active reference) or ready for garbage collection. It turns out there is a third state: in the finalizer queue. Objects which have a finalizer are placed on the finalizer queue. The object must be finalized before it is eligible for garbage collection, even if no references exist. The finalizer, in turn, runs through the queue on a single thread in the background. Discussion on SO.

Generally, finalization queue is avoided by having the Dispose method call SuppressFinalize, exempting the object from the finalizer queue.

But disposing is only used when an object incurs unmanaged resources. Why is it happening here, for a DataTable?

According to one discussion:

The Dispose method in DataSet exists ONLY because of side effect of inheritance-- in other words, it doesn't actually do anything useful in the finalization. The class DataSet inherits from "System.ComponentModel.MarshalByValueCompenent" which implements the IDisposable interface because it is a component.

Great. So DataTable's have a finalizer, which means they get stuck in the finalization queue for a while before the garbage collector can dispose of them. But wait! When we return a DataTable via WCF, WCF will call dispose on both parameters that are passed in and returned parameters. So how can this be explained?

Looking at the service code, we already learned that when a too-large table is created, it is instantiated in memory and the rows counted. Then, if there are too many rows, the table is NOT returned via WCF to the client; instead, a message telling the client to "request fewer rows" is sent. What happens to the DataTable (the one with TONS of rows)? It simply goes out of scope. No Dispose is ever called. That's why the large table is waiting on the finalizer queue, blocking lots of memory.

This problem could be avoided by implementing the SQL-side row counting (as described above), and also by manually calling Dispose() if the service decides it will not be returning the table to the client.

Conclusions

Garbage collection isn't magic. Some actions should be taken to ensure long-running applications and services don't leak memory. WinDbg is an awesome tool for uncovering memory leaks.

Planned changes for this particular application. Some of these might seem obvious in hindsight, but at the time, I just assumed the overhead wouldn't be a problem.

  • In RDL handling
    • report.ReleaseSandboxAppDomain();
    • Unsubscribe to any SubreportProcessing events
    • Clear Data Sources
    • Dispose the report
  • In GetChangeTable
    • The server should ALWAYS require the client to request a subset of rows when a resync is performed
    • The SQL procedure should be modified to take the max rows as a parameter, and simply return a message to the service if there are too many rows (rather than returning the whole table, having the service instantiate it in memory, and then count the rows)
    • If the service generates a DataTable that it decides not to return to the client, Dispose() should be called
    • When DataTable is placed into a larger object for WCF serialization, that object should be marked with IDisposable and should, on Dispose, dispose the DataTable

A Truly Random() Heisenbug

A Heisenbug is a type of bug that disappears or alters its behavior when you attempt to debug it.

A coworker came to me today with an apparent odd behavior, which he suspected was the fault of a compiler optimization bug. Basically, the code worked through nested loops to generate a derived image from a base image.

Imagine something like:

for (...) {
  do {
    p1 = baseImage.getPixel(x1, y1);
    p2 = baseImage.getPixel(x2, y2);
    ... // do stuff with p1 and p2
  } while (...) // condition on p1 and p2

  newImage.setPixel(x, y, ...) // color based on p1 and p2 result
}

This code worked completely correctly, but was a little slow. Getting and setting pixels via the Image API is the slow part, so he wanted to introduce a cache (basically, read all the pixels into a 2-D array upfront). This seems straightforward.

double[,] cache = ... // get all pixel intensities into 2-D array
for (...) {
  do {
    p1 = cache[x1, y1];
    p2 = cache[x2, y2];
    ... // do stuff with p1 and p2
  } while (...) // condition on p1 and p2

  newImage.setPixel(x, y, ...) // color based on p1 and p2 result
}

However, when run, this produced plausible but visibly incorrect output. The output made using the cache version contained “block”-like visual artifacts, while the output from the original version was smooth.

He fiddled with it for a while and then asked for advice. He told me up front that he suspected the do-while loop was either incorrectly being optimized or itself had a bug.

My initial thought, of course, was that the cache wasn’t accurate. There were three ways the cache could be inaccurate that I identified:

  1. The cache did not actually contain the correct initial values in the correct ordering
  2. An essential part of the algorithm involved modifying the base image as the work progressed, and the use of cache was disrupting this process
  3. The cache was inadvertently being modified during the process

I wanted to verify that baseImage and newImage were entirely unrelated buffers, that no writing to baseImage occurred, and no writing to cache occurred. This was all verified with code inspection (he had already done this, and I did it too, confirming his result).

Then my coworker showed me something disturbing. He simply reintroduced one call to the Image API, discarding the result:

double[,] cache = ... // get all pixel intensities into 2-D array
for (...) {
  do {
    unusedGarbage = baseImage.getPixel(x1, y1);
    p1 = cache[x1, y1];
    p2 = cache[x2, y2];
    ... // do stuff with p1 and p2
  } while (...) // condition on p1 and p2

  newImage.setPixel(x, y, ...) // color based on p1 and p2 result
}

This immediately resolved the problem, even though the variable “unusedGarbage” was in fact never used, and NO other changes were made. Additionally, as extra proof, he showed an assertion against both the cache and original image:

double[,] cache = ... // get all pixel intensities into 2-D array
for (...) {
  do {
    op1 = baseImage.getPixel(x1, y1);
    op2 = baseImage.getPixel(x2, y2);
    p1 = cache[x1, y1];
    p2 = cache[x2, y2];

    Debug.Assert(p1 == op1);
    Debug.Assert(p2 == op2);
    ... // do stuff with p1 and p2
  } while (...) // condition on p1 and p2

  newImage.setPixel(x, y, ...) // color based on p1 and p2 result
}

These Asserts succeeded completely, proving the cache and image were identical.

Based on this research, he believed that the presence of the Image API call, or its absence, changed the way the compiler optimized the loop; and that the loop optimization using the cache must be incorrect.

I was totally baffled at this point. It took a minute of just thinking:
Computers Do Not Work That Way

After clearing my head of disbelief, I decided to see what else I could come up with. Console writing each p1 and p2 was far too numerous to view, but adding them up into a sum made for a quick poor-man’s check.

double[,] cache = ... // get all pixel intensities into 2-D array
int sum = 0;
for (...) {
  do {
    p1 = cache[x1, y1]; //  baseImage.getPixel(x1, y1);
    p2 = cache[x2, y2]; // baseImage.getPixel(x2, y2);
    sum += p1;
    sum += p2;
    ... // do stuff with p1 and p2
  } while (...) // condition on p1 and p2

  newImage.setPixel(x, y, ...) // color based on p1 and p2 result
}
Console.WriteLine(sum);

We tried this with both the cache and Image API call. In the output image, we could see the distinct difference between the two. However, the calculated sum was identical in both cases! This suggested that the actual loop was running the same and producing the same results.

At this point, I started to wonder about the setting of the pixel on the new image. The … above is an over-simplification; the code was something more like:

double[,] cache = ... // get all pixel intensities into 2-D array
for (...) {
  do {
    p1 = cache[x1, y1]; //  baseImage.getPixel(x1, y1);
    p2 = cache[x2, y2]; // baseImage.getPixel(x2, y2);
    sum += p1;
    sum += p2;
    ... // do stuff with p1 and p2
  } while (...) // condition on p1 and p2

  Random r = new Random();
  if (p1 == p2)
     newImage.setPixel(x, y, r.randomColor())
  else
     newImage.setPixel(x, y, specificColor)
}

We had ignored this section of code as not relevant to the output. After all, the behavior is simply based on the output of the do-while, and if the do-while is working the same, then certainly this code must behave the same. Right?

Noting that Random should not be re-instantiated during program run, I promoted the variable to before the loops and picked a fixed Random seed so that we could compare the output without the differences in Randomness.

Random r = new Random(1); // FIXED seed
double[,] cache = ... // get all pixel intensities into 2-D array
for (...) {
  do {
    p1 = cache[x1, y1]; //  baseImage.getPixel(x1, y1);
    p2 = cache[x2, y2]; // baseImage.getPixel(x2, y2);
    sum += p1;
    sum += p2;
    ... // do stuff with p1 and p2
  } while (...) // condition on p1 and p2

  if (p1 == p2)
     newImage.setPixel(x, y, r.randomColor())
  else
     newImage.setPixel(x, y, specificColor)
}

In this case, both the cache and non-cache versions output was identical! The problem appeared to go away. I removed the fixed seed, and the problem remained solved.

How so?

When a Random() instant is created in .NET, it is seeded with the system time by default. In fact, the MSDN docs warn:

The default seed value is derived from the system clock and has finite resolution. As a result, different Random objects that are created in close succession by a call to the default constructor will have identical default seed values and, therefore, will produce identical sets of random numbers.

Fair enough, but how does this explain the difference in behavior? Why was the program working correctly originally given that it was performing this re-instantiation of Random all along?

In the original version of the program, the Image API calls in the inner loop, being quite slow, were sufficient to cause the initial seed (system time) to be DIFFERENT for each instantiation of Random, thus producing a plausible Random-ish sequence. However, when the cache was used, it was much much faster, causing repeated Random instantiations with the SAME system time, thus generating a series of identical values, appearing as visual “blocks” in the output image.

Moving to HTTPS

In the early days of the web, HTML documents were served over HTTP. The original HTTP protocol was a simple human-readable ASCII implementation. Over time, two major changes came to HTTP: In 1994, Netscape introduced an encryption and verification layer known as HTTPS; and in 2015, the W3C finalized the HTTP/2 specification, which includes data compression and server push (bidirectional) capabilities.

HTTPS was originally envisioned only for high-security situations, like banking and e-commerce, but with en-route content injection and other security concerns, vendors began pushing for increased use of encryption and verification. In 2010, a Firefox extension “HTTPS Everywhere” was released, one of the first hints that all traffic would eventually be transferred over an encrypted channel.

Fast forward to 2016. Browser vendors have increased the urgency of moving sites to HTTPS. Google and Firefox have joined efforts to deprecate non-secure HTTP. W3C has joined in, saying that “We recommend that such legacy functionality begin requiring a privileged context as quickly as is reasonably possible.” Current versions of Chrome and Firefox already issue console warnings for data submission over HTTP, and within a year, in one of the first major breaks in backwards compatibility for the web, many existing capabilities will be rejected over HTTP.

Adoption of HTTPS has been held back by the cost of certification (a TLS certificate can easily more than double the cost of web hosting) and, for those running their own servers, the complexity of installation. To act as the carrot corresponding to the aforementioned stick, major web players have created the Extended Verification certificates.

Domain operators who have not yet done so should move to HTTPS by:

  1. Acquiring and installing a TLS certificate from Let’s Encrypt or another reputable source.
  2. Verify and correct any failing/warning components (in particular, any absolute URLs involving http:// should be identified and replaced with https://, as these will cease to work in the future)
  3. Adding a server rewrite rule to redirect all HTTP requests to HTTPs.
  4. Ensuring that subsequent client connections can’t be hijacked via HTTP using HSTS to tell the client to never attempt to connect over non-secure HTTP again. An additional server rewrite rule enables HSTS.

You can check the certificate of your site by verifying the green lock icon:

https

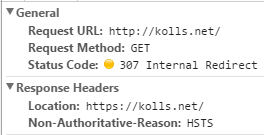
You can also check that HSTS is forcing the HTTPS version of your site by attempting to go to the HTTP only URL and observing an “internal redirect”:
hsts

.NET Decimal Precision

I was confronted by a very unusual claim by a coworker: two .NET Decimals, containing the same value, running through the same block of code, were rendering differently (one as, say, “120” and one as “120.00”). One of the big advantages of Decimal is that, unlike Float or Double, a Decimal represents an exact base-10 value whereas Float and Double are base-2, and so can only approximate many common fractional base-10 values. Therefore, I don’t normally expect problems of this kind with Decimal.

I initially assumed that the coworker was confused; some other input must be coming in, or a different section of code executing, or a different string formatting code used. However, the problem clearly reproduced. Further, it occurred even when no fractional component existed. But stripping away the extraneous, the essence of the code was fairly straightforward:

decimal v = ...;
return v.ToString();

Detailed inspection revealed that in one case, the decimal value was loaded from the user input, and in another case, it was loaded from a database table. In order to test the significance of this, I made a test case which performed both side-by-side. At first, everything seems routine:
decimals

What happened next was anything but routine:
decimals2

What would cause one decimal to render with 2 decimal places and another, the exact same value, to render without them? It turns out that the .NET Decimal implementation intentionally includes the concept of significant trailing zeros, which have no impact on calculations but can carry information about the value’s precision.

Although there is no direct method to expose the precision, the details of the significant trailing zeros arrangement are discussed in the Decimal.GetBits method documentation. In this case, it is clear that the same logical value can be represented with different exponents. In the case above, we can have a value of 120 with an exponent of 0, and a value of 12000 with an exponent of 2 (the exponent “indicates the power of 10 to divide the integer number”), so 12000 * 10-2 = 120.00.

This is indeed confirmed by analysis. The first three bytes contain the value, while the exponent is defined as “Bits 16 to 23” of the fourth byte.

Decimal.GetBits(vFromUser) = [120, 0, 0, 0]
Decimal.GetBits(vFromDb) = [12000, 0, 0, 131072]
131072 >> 16 = 2

This confirms the vFromDb value is represented as 12000 * 10-2 while vFromUser is represented as 120 * 100. Although these values are logically equal, the default implementation of Decimal.ToString() outputs the value with all significant zeros, including trailing zeros.

Although the Decimal class does not expose properties for the precision nor the scale, it is possible to take advantage of the helper SqlDecimal class to access these values. In this context, precision means the total number of digits and scale means the number of digits to the right of the decimal place.

var sFromDb = new System.Data.SqlTypes.SqlDecimal(vFromDb);
Console.WriteLine(sFromDb.Precision);
Console.WriteLine(sFromDb.Scale);

For vFromDb, this outputs a precision of 5 and a scale of 2; while for vFromUser this outputs a precision of 3 and a scale of 0.

Outlook, Unicode, and Copy-Paste

It seemed straightforward: the customer told me they wanted the system to generate an email, and that they would send me the content (a parameterized one-liner). I copy/pasted it into the application source code as a string and parameterized it as specified. I tested the email, and it worked correctly.

Aside: At this point, someone will be saying the email content should have been placed as a resource or template file, and not a string in the source code. Such a claim is correct, but the email content is very short, so it wasn’t worth the extra effort. Also, it would have had no impact on this particular situation.

Having tested it myself, I commit’d the change and sent it to the user for testing. What happened next was a bit … unexpected.

Hi Steve,

It appears we are getting some special characters instead of the – for the Pending Timesheets Subject text. Not sure if we could encode this?

IMPORTANT – Timesheet Not Created – will effect pay

The customer interpreted the issue as a failure to HTML encode the content, except that:

  1. The dash doesn’t need to be HTML-encoded.
  2. I did HTML-encode the message and subject line, although the subject line doesn’t support HTML, so a failed encoding would show up as an explicit HTML entity not a random-seeming sequence of characters.

What it does look like is a Unicode representation issue. Was the dash somehow coming across as a multi-byte Unicode character to a client that didn’t support Unicode?

I tested again, and I wasn’t able to reproduce the problem, but I suspected I knew why it happened. A little investigation confirms that during typing, Outlook autoreplaces hyphen with en-dash when used in a stand-alone way.

Although the hyphen is a normal ASCII symbol (0x2D), the en-dash is represented by multi-byte Unicode code-point (0x2013, to be precise), so if anything non-Unicode compliant receives it, it will render as a sequence of characters.

When someone (the customer or one of his associates) typed the desired phrase “IMPORTANT – Timesheet Not Created … ” into Outlook, Outlook automatically replaced the hyphen with an en-dash, then I just copy/pasted that directly into my code (rather than retyping it, as Visual Studio does no such replacement).

How could I confirm my suspicion, since I couldn’t reproduce the issue myself? I used a hex editor (the 80s are back, baby!) to examine the actual content of the subject line from my source code. You can see in this hex screen the difference between what I copied from Outlook (top) and manually using the hyphen (bottom):

Hex comparison

Anyways the fix is easy: manually replace the en-dash with a regular hyphen.

I sent the email to myself, first with the original subject line (bottom) and then again with the hyphens. If you look closely, you can see that the dash looks different.

Subject line comparison

The hyphens should work fine in any situation.

What I never did figure out is … in this highly homogeneous Outlook-centric corporate environment, who was using a non-Unicode compliant email system and for what purpose?

Performance of array filter in JavaScript

Today a coworker remarked to me that he had been using the JavaScript native array method .filter, but found that writing a custom for loop to do the filtering was much faster. “How can this be?” we wondered, “Native is always faster!”

Since I’m skeptical by nature, my first move was to confirm my coworker’s claim in a controlled environment.

I created an array of a few million random numbers, and a function to filter then based on even or odd.

var vals = [];
for (var i = 0; i < 5000000; i++) {
    vals.push(Math.floor((Math.random() * 100) + 1));
}

var f = function(x) { return x % 2 === 0; };

Then I applied a performance measurement:

function measure(f) {
    var start = performance.now();
    f();
    var end = performance.now();
    var diff = end - start
    document.write(f + " took " + diff + " ms.<br />");    
}

I also wrote a completely naive for-loop based filter method which I attached to the Array prototype.

Array.prototype.naiveForFilter = function(f)   {    
    'use strict';
    var results = [];
    var len = this.length;
    for (var i = 0; i < len; i++) {        
        if (f(this[i])) {
            results.push(this[i]);
        }
    }
    return results;  
};

Finally, I compared the execution time of the two:

measure(function() { vals.filter(f) });
measure(function() { vals.naiveForFilter(f) });

The outcome (in Chrome) was shocking: the naive hand-rolled for loop ran in 1/5 the time of the native filter method. This seemed opposed to all possible common-sense. I asked my coworker if he had done any search, and he said there was an article from 2011, but he figured since it was so many years ago, it wouldn't still apply.

The article claims the slow-down is due to the additional safeties offered by the native method:

  1. It ignores deleted values and gaps in the array
  2. It optionally sets the execution context of the predicate function
  3. It prevents the predicate function from mutating the data

This still seems a little suspect, given that the native method was 5x slower. It also raises the question (just a curiosity) of how much impact each of those safeties costs. Is there one in particular that incurs a higher cost? To dig further, I pulled the Mozilla polyfill reference implementation for filter.

Adding this entry to my profiling, I found it about five times slower than the native method. Wow! So native, doing the same thing, is definitely faster. But still, the question is: where is the expense? I identified two possible cost centers visually in the polyfill: membership checking in the array using "in" and binding the context of the filter function using "call":

if (i in this) {
  if (f.call(thisArg, val, i, this)) {

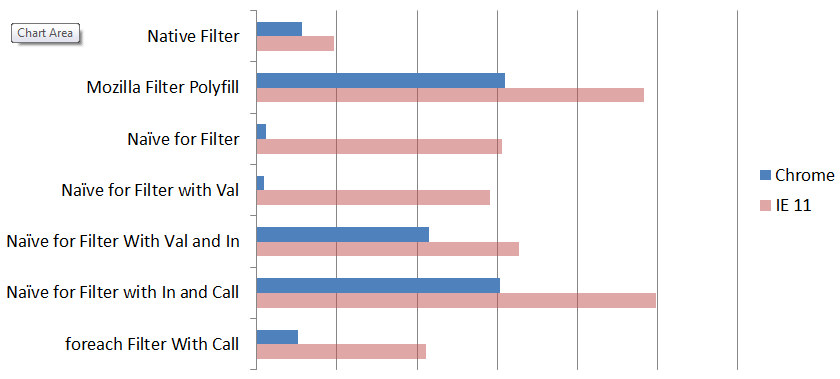
I guessed that the context binding was the slow part. But to find out, I made multiple versions of the filter function, beginning the naive implementation (known to be very fast), and incrementally adding checks until it approached the complexity of the reference polyfill (known to be very slow). I tested all implementations on both browsers on my machine (Chrome and IE 11). I also compared to an implementation using ES6 foreach.

filter speed

The performance differences are by far most significant in Chrome, where the use of "in" to validate if an element is present in the array is an extremely expensive operation. Introducing this check consumes the vast majority of time in the implementation. Note: this is not the same as an element being undefined, which is much cheaper check.

Interestingly, in IE 11 the performance is much more normalized, and it appears that the function binding (.call) is the most expensive incremental addition to the function, with the in being fairly cheap. IE 11 is also exposed as having poor JavaScript optimization capability, as even a tight naive JS loop is much much slower than a more involved native implementation, whereas in Chrome the opposite is true. I'm assuming Edge is much more performant but haven't tested.

So, even today, if performance is critical, it might be faster to hand roll a custom-tailored function as opposed to using the built-in natives, as the built-in natives may have special support (like filter does for sparse arrays) that are known to be not needed in your specific case. But as Knuth says, "premature optimization is the root of all evil", so always default to using the native functions unless you're sure you need something different.

Unit Testing: Scenario

I was forwarded the following question:

Good afternoon! I was hoping that you might have some advice or guidance on unit test coding in C#? I have read a lot on this and researched it on the internet. The internship has me doing a lot of it right now. I am still confused about how to exactly to approach it, what would be a good strategy? I believe it is similar to validation. Any help would be appreciated.

To show a little bit about how unit tests can be applied in C#, consider this actual customer request which I handled today.

We would like to modify how the “Description/Keywords” field functions as follows:

Search by “Description/Keywords”

  1. A search for 1 keyword will display all firms that have the keyword in description field (as it currently functions)
  2. A search for 2 or more keywords will display all firms that have ANY or ALL keywords in description field, depending on user selection.
  3. We will be removing ”Starts with” and ”Contains” radio buttons for this item only.

The field search used to be based on a contains/starts with option that matched entire substrings. Now the user wants to match keywords in any order. Can we implement this change with the assistance of unit testing?

Start by declaring a method signature to accomplish the task desired:

public enum SEARCH_KEYWORDS { All, Any };
bool SearchKeywords(string haystack, 
    string needle, 
    SEARCH_KEYWORDS stype) { ... }

The body of the method may simply throw a NotImplementedException, or return false.

Next, we can create some unit tests describing functionality that is desired.

For example, it should match or not a single word, regardless of any/all.

[TestMethod()]
public void SearchKeywordsSingleWord()
{
    PublicSearchQueryBC target = new PublicSearchQueryBC();
    Assert.AreEqual(true, target.SearchKeywords("word", "word", PublicSearchQueryDTO.SEARCH_KEYWORDS.Any));
    Assert.AreEqual(true, target.SearchKeywords("word", "word", PublicSearchQueryDTO.SEARCH_KEYWORDS.All));
    Assert.AreEqual(false, target.SearchKeywords("words", "word", PublicSearchQueryDTO.SEARCH_KEYWORDS.Any));
    Assert.AreEqual(false, target.SearchKeywords("words", "word", PublicSearchQueryDTO.SEARCH_KEYWORDS.All));
    Assert.AreEqual(false, target.SearchKeywords("word", "words", PublicSearchQueryDTO.SEARCH_KEYWORDS.Any));
    Assert.AreEqual(false, target.SearchKeywords("word", "words", PublicSearchQueryDTO.SEARCH_KEYWORDS.All));
}

It should match or not a phrase, depending on the phrase and whether any/all is selected. (Note: you might instead wish to divide up the tests as “tests for any” and separately, “tests for all”)

[TestMethod()]
public void SearchKeywordsPhrase()
{
    PublicSearchQueryBC target = new PublicSearchQueryBC();
    Assert.AreEqual(true, target.SearchKeywords("lazy fox jumping bridge", "fox jumping lazy bridge", PublicSearchQueryDTO.SEARCH_KEYWORDS.All));
    Assert.AreEqual(true, target.SearchKeywords("lazy fox jumping bridge", "fox jumping lazy bridge", PublicSearchQueryDTO.SEARCH_KEYWORDS.Any));
            
    Assert.AreEqual(false, target.SearchKeywords("lazy fox jumping bridge", "lazy fox jumping goat bridge", PublicSearchQueryDTO.SEARCH_KEYWORDS.All));
    Assert.AreEqual(true, target.SearchKeywords("lazy fox jumping bridge", "lazy fox jumping goat bridge", PublicSearchQueryDTO.SEARCH_KEYWORDS.Any));

    Assert.AreEqual(false, target.SearchKeywords("lazy fox jumping bridge", "fox jumping lazy goat bridge", PublicSearchQueryDTO.SEARCH_KEYWORDS.All));
    Assert.AreEqual(true, target.SearchKeywords("lazy fox jumping bridge", "fox jumping lazy goat bridge", PublicSearchQueryDTO.SEARCH_KEYWORDS.Any));

    Assert.AreEqual(true, target.SearchKeywords("lazy fox goat jumping bridge", "fox jumping lazy  bridge", PublicSearchQueryDTO.SEARCH_KEYWORDS.All));
    Assert.AreEqual(true, target.SearchKeywords("lazy fox goat jumping bridge", "fox jumping lazy  bridge", PublicSearchQueryDTO.SEARCH_KEYWORDS.Any));

    Assert.AreEqual(false, target.SearchKeywords("lazy fox jumping bridge", "goat rubber ducky", PublicSearchQueryDTO.SEARCH_KEYWORDS.All));
    Assert.AreEqual(false, target.SearchKeywords("lazy fox jumping bridge", "goat rubber ducky", PublicSearchQueryDTO.SEARCH_KEYWORDS.Any));

}

You can think about other kinds of special cases that might be encountered. Should the search be case sensitive? Probably not, so better add tests to make sure it isn’t. Should the search consider punctuation? Definitely not, since it’s keywords. What about blank spaces? Blanks should never match (that’s my opinion), so add tests for it.

[TestMethod()]
public void SearchKeywordsPhraseCap()
{
    PublicSearchQueryBC target = new PublicSearchQueryBC();
    Assert.AreEqual(true, target.SearchKeywords("LAZY FOX jUMPING Bridge", "fox jumping lazy bridge", PublicSearchQueryDTO.SEARCH_KEYWORDS.All));
    Assert.AreEqual(true, target.SearchKeywords("LAZY FOX jUMPING Bridge", "fox jumping lazy bridge", PublicSearchQueryDTO.SEARCH_KEYWORDS.Any));

    Assert.AreEqual(false, target.SearchKeywords("LAZY FOX jUMPING Bridge", "fox jumping goat bridge", PublicSearchQueryDTO.SEARCH_KEYWORDS.All));
    Assert.AreEqual(true, target.SearchKeywords("LAZY FOX jUMPING Bridge", "fox jumping goat bridge", PublicSearchQueryDTO.SEARCH_KEYWORDS.Any));

}

[TestMethod()]
public void SearchKeywordsPunc()
{
    PublicSearchQueryBC target = new PublicSearchQueryBC();
    Assert.AreEqual(true, target.SearchKeywords("lazy, fox: jumping-bridge", "fox jumping lazy bridge", PublicSearchQueryDTO.SEARCH_KEYWORDS.All));
    Assert.AreEqual(true, target.SearchKeywords("lazy, fox: jumping-bridge", "fox-jumping. lazy, bridge", PublicSearchQueryDTO.SEARCH_KEYWORDS.All));
            

}


[TestMethod()]
public void SearchKeywordsBlanks()
{
    PublicSearchQueryBC target = new PublicSearchQueryBC();
    Assert.AreEqual(false, target.SearchKeywords("lazy fox jumping bridge", "", PublicSearchQueryDTO.SEARCH_KEYWORDS.All));
    Assert.AreEqual(false, target.SearchKeywords("lazy fox jumping bridge", "", PublicSearchQueryDTO.SEARCH_KEYWORDS.Any));

    Assert.AreEqual(false, target.SearchKeywords("", "", PublicSearchQueryDTO.SEARCH_KEYWORDS.All));
    Assert.AreEqual(false, target.SearchKeywords("", "", PublicSearchQueryDTO.SEARCH_KEYWORDS.Any));

    Assert.AreEqual(false, target.SearchKeywords("  ", "", PublicSearchQueryDTO.SEARCH_KEYWORDS.All));
    Assert.AreEqual(false, target.SearchKeywords("", "    ", PublicSearchQueryDTO.SEARCH_KEYWORDS.Any));

    Assert.AreEqual(false, target.SearchKeywords("", "lazy fox jumping bridge", PublicSearchQueryDTO.SEARCH_KEYWORDS.All));
    Assert.AreEqual(false, target.SearchKeywords("", "lazy fox jumping bridge", PublicSearchQueryDTO.SEARCH_KEYWORDS.Any));
            
}

Now run the tests. They should all (or almost, depending on the naiveness of the original implementation) fail. That’s fine. Next, go ahead and implement the method, and run the tests again.

no blank

Looks like a test is failing. Turns out my initial implementation didn’t handle blanks the way I expected. So I went ahead and fixed it, and ran the tests again.

fixed blanks

This is where the tests really start to shine. I fixed the blank issue, but, in the progress, accidentally introduced another bug! Once all the bugs are resolved, all tests should pass.

This is a good time to refactor the implementation and make it cleaner, if needed. The tests should be used to ensure functionality isn’t damaged. This is a pattern known as Red-Green-Refactor.

Let’s say you then send the implementation to QA, and a bug is reported. The first step is to add a new failing test reproducing the bug. Then, proceed to fix the bug. You’ll have confidence that the bug is fixed and no regression has occurred when all tests are again showing green.

Enforcing Single Application Instances in WPF with Named Pipes

In some cases, we may wish to prevent the user from starting multiple instances of applications. Instead, the existing (single) instance should be focused. The “single instance” part is pretty easy, but notifying the first instance to come to the front is more tricky. There are many attempts to demonstrate techniques for this around the net, but I found them difficult and unreliable in WPF. In particular, they mostly all depend on using WndProc broadcast messages which are only received when the target window is not minimized, and even then not reliably. Further, there would be no way to actually send any data (like a command line) from the new instance to the original instance.

Rather than continue to struggle with this unproductive path, I took a step back and thought about what I wanted to do: I want to send a message from one instance of an application to another. Isn’t that what named pipes are for?

I created an abstraction based on mutexs (to enforce single instancing) and named pipes (to communicate between instances) that easily allows an application to ensure only a single instance is used. The abstraction could easily be expanded to allow for passing data to the single instance.

Get it on GitHub

To use this abstraction, omit a StartupUri from App.xaml and override OnStartip in the App.xaml.cs:

public partial class App : Application
{
  protected override void OnStartup(StartupEventArgs e)
  {
    // Set a unique application ID
    Guid id = Guid.Parse("DC2A927C-AC89-4512-BB29-7AB0A18DE105");

    // Instantiate an SIA
    SingleInstanceApplication sia = new SingleInstanceApplication(id);            
    // Handle the ApplicationStarts event
    // When this event fires, initialize the application
    sia.ApplicationStarts += (sender, earg) =>
    {
      var mw = new MainWindow();
      mw.Show();
      // If another instance attempts to start, 
      // bring our window to the front
      sia.AnotherInstanceAttemptsToStart += 
        SingleInstanceApplication.BringToFrontWhenCalled(mw);
    };
    // Optionally handle AnotherInstanceAttemptsToStart, for example, 
    // to log other attempts
    sia.AnotherInstanceAttemptsToStart += (sender, earg) =>
    {
      Logger.LogInfo("### Captured another instance trying to start");
    };
    // Run the application and single instance protection
    sia.RunSingleInstance();            
  }

JavaScript scoping strikes again

We have a for loop that populates an observable array in knockout. For some reason, only the first item started being loaded, even though we hadn’t made any changes to the loop, and all the data was still being sent down.

The loop starts off:

for (i = 0; i < ts.Weeks.length; i++) {

I stepped through the loop using Chrome debugger and found that i=0 consistently, all the way until the very end of the body, when we added the data object to the observable array:

self.Weeks.push(week);

At this point, it jumped to i=10 right before going back to the top. Of course, with only a half-dozen data items, the loop then exited. But, nothing else in the loop modifies i, and where was 10 coming from anyways??

Since the array was observable, when it was updated with push, knockout also called all the various “computed” functions. Also since the for loop variable “i” was declared without var, it was actually in the global scope! One of those computed (I didn’t figure out which one), or a library that they used, also had an “i” that was in the global scope, and the two variables were clobbering each other.

Although I didn’t determine the other perpetrator code, simply updating the loop, by adding var, to read

for (var i = 0; i < ts.Weeks.length; i++) {

solved the issue by ensuring the variable i was function scoped.

It’s easy to forget in languages like C# that don’t do global scope by default… JavaScript does do global scope by default!

Arbitrary Clustering in SQL: Tumbling down the rabbit hole

Subtitle: “Things are not as they appear, nor are they otherwise.”

For a demo (in other words, nothing matters), I wanted to take a set of rows of sample data and cluster them into a few groups approximately the same size. I figured “I’ll use a random number”. My first flaw, of course, was to decided on a solution before I fully considered the meat of the problem. But anyways…

So I fool around with RAND() in SQL and I’m not getting good results. I look online and find this Microsoft article: Selecting Rows Randomly from a Large Table. Sounds like it might have something good. They advise a syntax like this for random [see aside, at bottom]:

SELECT * FROM Table1
  WHERE (ABS(CAST(
  (BINARY_CHECKSUM(NEWID()) *
  RAND()) as int)) % 100)

Of course replacing 100 with whatever upper bound is desired.

I’ll try it out with my table:

SELECT CustomerID, 
  (ABS(CAST((BINARY_CHECKSUM(NEWID())) as int)) % 3) 
  FROM dbo.Customers

Looks good! Eyeballing indicates an approximately equal distribute of 0, 1, and 2. No other values.

Now I want to substitute a named value for each possible random value, so I put this expression into a case statement, like:

SELECT CustomerID, 
  CASE (ABS(CAST((BINARY_CHECKSUM(NEWID())) as int)) % 3) 
    WHEN 0 THEN 'Alice'
    WHEN 1 THEN 'Bob'
    WHEN 2 THEN 'Charlie'	
   END Value,
 FROM dbo.Customers

Now things get interesting. Some of the values returned are NULL! How is that possible. Furthermore, if I investigate the distribution, e.g. with:

SELECT TBL.Value, COUNT(*) FROM
(
  SELECT CustomerID, 
    CASE (ABS(CAST((BINARY_CHECKSUM(NEWID())) as int)) % 3) 
      WHEN 0 THEN 'Alice'
      WHEN 1 THEN 'Bob'
      WHEN 2 THEN 'Charlie'	
    END Value	
  FROM dbo.Customers
) TBL
GROUP BY TBL.Value

I get a very non-uniform distribution. I tried it again on a table with more rows, to get a better feel for the distribution, and found an experimental result of:

Value Count Approx % of Rows
Alice 696 32%
NULL 621 29%
Bob 527 24%
Charlie 311 14%

Repeated runs returned similar results. Removing the case statement and just having the inner expression resulting in an approximately uniform distribution of 0, 1, and 2.

How can this be?

I thought about it for a while and concluded that the expression must be being re-evaluated for each “when” of the case statement. This is the only thing I could come up with that would allow for the NULL possibility. But would it generate the distribution being observed? If so, that would confirm the effect.

Since we observed the generator alone was approximately normal, we’ll call it f() and say that the range of f() is {0, 1, 2} with uniform probability.

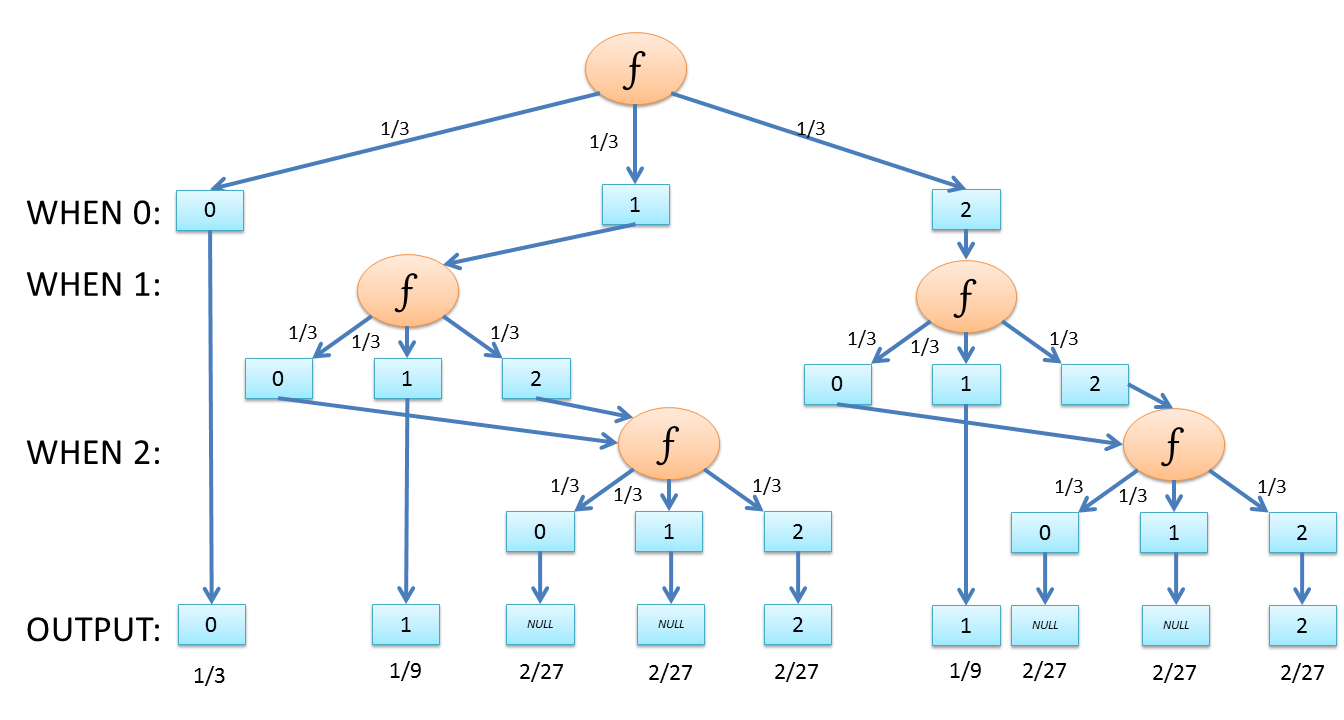
If f() is being re-evaluated at each WHEN, we end up with a probability distribution as follow:
Probability Distribution

Grouping and summing the probabilities gives us:

Value Theoretical Probability Observed Approximate Probability
Alice (0) 1/3 = 33.3% 32%
NULL 8/27 = 29.6% 29%
Bob (1) 2/9 = 22.2% 24%
Charlie (2) 4/27 = 14.8% 14%

Theory confirms observation: f() is being re-evaluated at each WHEN.

But you already know what I’m going to tell you

Remember the whole intention of this, originally, was to arbitrarily (not necessarily randomly!) partition a set of records into several roughly equal sets. There is a much more straightforward approach if randomness is not required: simply use ROW_NUMBER().

SELECT CustomerID,
  CASE (CAST(ROW_NUMBER() OVER(ORDER BY CustomerID) AS int) % 3) 
    WHEN 0 THEN 'Alice'
    WHEN 1 THEN 'Bob'
    WHEN 2 THEN 'Charlie'	
  END Value
FROM dbo.Customers

Slight Aside

I went back and reviewed the original article and found that NEWID() is actually only advised in conjunction with other named columns. Otherwise, BINARY_CHECKSUM(*) is advised. If BINARY_CHECKSUM(*) is used, everything seems to work out fine! So, to be more specific, NEWID() (and thus, BINARY_CHECKSUM) is being re-evaluated at each row, but RAND() is not. Further, the article notes that RAND() is not needed when NEWID() or a column is specified. So, this whole problem originated in my skimming the article too quickly, and conflating two examples into one!